
A common saying in the genetic genealogy community is “friends don’t let friends test just for those percentages.”
Ethnicity estimates can only tell a tester so much, and the real meat to chew on is found among your DNA relatives. However, ethnicity estimates are usually why people initially decide to test, 1. because let’s face it–they’re fun! and 2. because testers are often unaware of the bounty of information provided in their match list. Since ethnicity estimates are often where people begin (including me), I thought this would be a fitting topic for my first blog post.
First, there are three major DNA testing companies considered to be “legitimate”, known as The Big Three. They are:
- 23andMe
- AncestryDNA
- FTNDA
23andMe is widely considered to have the most accurate ethnicity estimates, with AncestryDNA a close second. FTDNA is a distant third in terms of intracontinental accuracy, but an update to their MyOrigins feature is expected later this year.
Below I explore the ethnicity estimates for my personal kit across a few platforms. I originally tested with AncestryDNA (23andMe won’t be covered in this blog), then transferred the data to FTDNA, DNA.Land, WeGenes, and Gedmatch. Let’s have a look at the discrepancies across these companies given the same raw data.
First, let’s look at the AncestryDNA results.

The 2% Asia South was somewhat of a surprise, but considering our paternal lineage y-dna haplogroup is of a possible Persian Jewish origin, it didn’t strike me as inaccurate–or “noise”, as trace regions of small amount are often called.
Next, comparing the same kit to FTDNA’s ethnicity estimate, we see some slight differences.

Again, this is the same test based on my DNA sample at Ancestry. Notably, the Scandinavian component is significantly lower, and the Eastern European component higher. This is because 1. as mentioned, FTDNA is not considered to be quite as finely-tuned as AncestryDNA testing, and 2. different companies use different reference populations to calculate their ethnicity estimates. This can be frustrating for researchers, but also illustrates how ethnicity calculation is not an exact science–in fact, it is often referred to as “cocktail party conversation”, one of the reasons ethnicity reports are not widely emphasized by professional genetic genealogists.
Well-known genetic genealogist and web programmer Kitty Cooper demonstrates this in her blog post “One company’s British might be another company’s Scandinavian…these predictions reach further into the past than our family tree does and may reflect earlier migrations around Europe. Finally, predicting deeper ancestry is not yet firm science or these companies would be closer to each other in their results.”
Next up is DNA.Land.
While not a testing company per-se, this website is administered by researchers from Columbia University and the NY Genome Center. It is a non-profit, so participation is free and highly encouraged to contribute to scientific research.

DNA.land is relatively new, and has a few bugs to be worked out in its ethnicity estimate. Most notably, it widely exaggerates the Ashkenazi component for testers. This is a known problem. As we saw in the AncestryDNA results, which were true to my paper trail, I’m 25% Ashkenazi–not 37%.
For some testers like Cooper, DNA.Land has actually underestimated Ashkenazi heritage–further confusing the issue. Like me, she has known Ashkenazi ancestry in the amount of 25%, but DNA.land estimated her kit to be significantly less at 16%.
Next we look to WeGenes
WeGenes is not among The Big 3 testing companies and considered practically useless for European testers. It is based in China, and is most reliable for Asian ethnicities. Because I have trace amounts of Asian heritage, I thought to include it here.
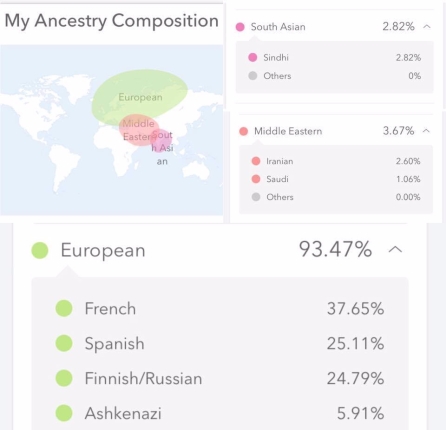
The South Asian–Sindhi, Middle Eastern–Iranian, and Middle Eastern–Saudi, are more likely to be reflective of actual ancestry. I do not have a paper trail to India or Pakistan, where the Sindhi originate, however, once again our paternal haplogroup has origins in Ancient Persia. So the Iranian component could fit with what we already know. More on this below.
GEDmatch.com
GEDmatch.com is not a testing company per-se, but is considered the Holy Grail for DNA researchers. GEDmatch has a myriad of useful features, including a number of admixture (ethnicity) calculators, with region-specific reference populations to meet a wide range of research needs.
To begin with, let’s check the standard Jtest results.

Gedmatch Gedrosia Near East Neolithic k13


What’s interesting about these oracles is that they very nicely display that I have one Jewish grandparent. Moreover, it gives us a look further back in time before Ashkenazi Jews existed as a culture to get a feel for where my grandfather’s family originated from. The recurring Jew_Iranian and Jew_Iraqi would be in line with what we know about the origins of the haplogroup R2a/M124 arising in Babylon and Persia, during the period of the Jewish Captivity in Babylon. More on this in an upcoming blog post once FTNDA finishes processing our y-37 upgrade. Those subjects are beyond the scope of this introductory post, and will have their own dedicated post soon.
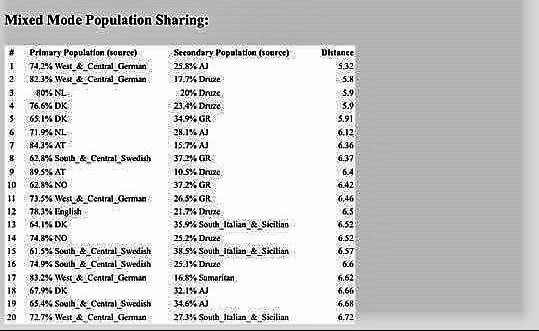
The Eurogenes EUtest V2 k15 admixture calculator
The Eurogenes EUtest V2 k15 admixture calculator doesn’t tell us much by the pie chart alone, but once we click on the oracle we get some really interesting information.


What’s interesting here is my kit is suddenly clocking in as SEPHARDIC! I reached out to an expert on Sephardic and Mizrahi DNA, and she confirmed that this calculator has a reliable Sephardic reference population. Unlike with the paternal haplogroup suggesting a Mizrahi origin for my grandfather’s line, I had no idea that there was any Sephardic DNA in our family at all. The Eurogenes reference panel is not from ancient remains like the Gedrosia Near East Neolithic, so we’re looking at a much more recent event here. Historically it is well-known that Mizrahi Jews moved into the area of the West Mediterranean and into the Iberian Peninsula, probably through Rome. So although it was a personal surprise to find Sephardic heritage, it certainly meshes well with what we know about the origins of European Jews.
This will be covered more extensively in an upcoming blog post, as mentioned. I’m looking forward to sharing the research I’ve uncovered, along with some terrific reference material and expert opinions in the next post.
References
Cooper, K. (2016, April 16). Ancestry Composition Comparisons: a Case Study. Retrieved March 06, 2017, from http://blog.kittycooper.com/2016/04/ancestry-composition-comparisons-a-case-study/
Further Reading
Estes, R. (2017, January 15). Concepts – Calculating Ethnicity Percentages. Retrieved March 08, 2017, from https://dna-explained.com/2017/01/11/concepts-calculating-ethnicity-percentages/
For an exhaustive overview of the difference ethnicity analysis tools available on the web that aren’t covered here, ISOGG-International Society of Genetic Genealogists- is the go-to Wiki. http://isogg.org/wiki/Admixture_analyses
